Northeasterly: Economic Indicators for Non-profit Budgeting
It is the time of year when most non-profit organizations across the region are preparing their FY27 budgets. What are the economic forces and trends that could affect giving over the course of the next fiscal year? In this Northeasterly, we scan the macro environment for clues about what is in store for non-profits in the months to come. This piece is a little different (and somewhat longer) than our usual focus on best practices and case studies and I’m not going to apologize for that.
Macro Summary
While the global economy and our national economy are both strong in terms of underlying fundamentals, general uncertainty and specific risk factors cause for concern. Valuations are at historically high levels, leaving many investors (rightly or wrongly) to assume that a pullback or correction is likely in the near term. Rising inflation is reducing the likelihood the Federal Reserve’s Open Market Committee will reduce the federal funds rate, and in fact investor behavior and statements by FOMC members indicate that it is as likely that the FOMC will need to increase interest rates as it is that they will reduce them during the next year. Rising bond yields have siphoned some funds that otherwise would have gone into equities to bonds and bond funds, as investors are finding risk-free and low-risk returns in debt that are more appealing than alternatives in the equities market. Prices for food, shelter, and energy are rapidly accelerating, placing pressure on most households. Artificial intelligence, and the actual and imagined improvements that flow from it to productivity, is increasingly cited as a reason for reducing labor inputs; meanwhile, the productivity gains and increased margins actually or potentially associated with that technology are accruing to a very small segment of the population and leading to some dis-employment in the higher wage segments of the labor market.
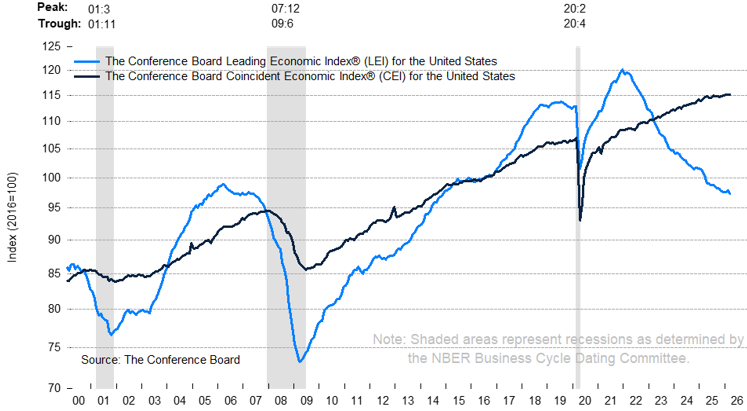
The current economic indicators are rising, while the leading indicators are falling. The U.S. economy is clearly in a slowdown and are likely entering a correction. Diffusion data indicates that the downturn is broad, though the depth and duration do not meet the criteria for a current or imminent recession.
Economic Indicators
Below we will dig into a few key economic indicators that could affect the bottom line for non-profits across the region. I emphasize could because the expenditures of non-profits vary significantly, revenues are also a function of the strength of each organization and its development efforts/donor relationships, and because resource-constrained donors do tend to focus their giving on areas of greatest need. Related to the latter, donations to some types of organizations (such as social service organizations) tend to be less affected during periods when donors are pulling back.
Before we get started, a couple of useful data points from Giving USA’s 2025 data tables: (1) every year since 1997, total giving as a percentage of GDP has been in the range of 1.9% to 2.2% of GDP (in case you are curious, it was 1.9% during the Great Recession and has been above that level every year since); and (2) total giving as a percentage of disposable income has been in the range of 1.8% to 2.4% every year since 1996 (again, it was also 1.8% for 3 years in a row during the Great Recession). So, as the economy contracts and/or as people have less money, then overall they do end up contributing less.
Now let’s look at a few economic indicators and their relationship to giving in recent years.
Consumer Confidence
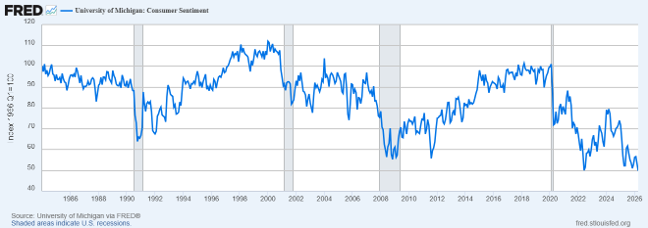
U.S. consumers are not only less confident than they were when the current administration took office, but they are also less confident than they were at any time in memory, including the depths of the Great Recession and the summer of 2022.
Over the past 60 years, the monthly University of Michigan Consumer Confidence Index has averaged 85.5. On April 1, 2026, that reading was only 49.8. For reference, the lowest reading of the Consumer Confidence Index during the Great Recession was 55.3, and prior to this month the lowest reading was 50.0 in June of 2022. We’re on quite a run right now because the index has been below the lowest level it reached during the Great Recession for 6 of the past 8 months.
Most years, individual giving exceeds individual giving in the previous year – in fact, individual giving has declined only 8 times over the past 4 decades. Often, these declines in individual giving correspond to declines in consumer sentiment.
Large declines in the monthly average consumer sentiment index have generally been associated with declines in individual giving, with the notable exception of 2020, when the consumer sentiment index dropped by 15.0%, but individual giving increased by 7.3%. However, consumer sentiment was dropping for reasons that were not only economic in nature, and the federal government (under the first Trump administration) was sending what economic policy nerds sometimes call “helicopter money” to every household. Put differently, 2020 does not fit neatly into the patterns that are evident when looking at the 1984-2024 data.
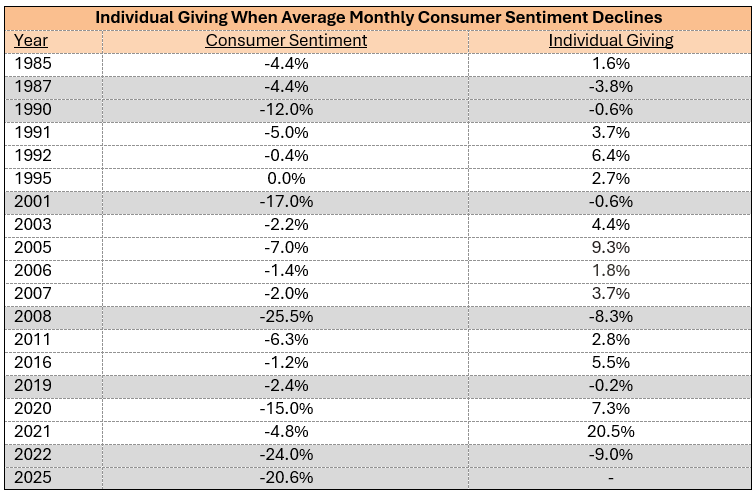
Data from the University of Michigan Consumer Sentiment Index and from Giving USA indicate a relationship between substantial deterioration of consumer sentiment and individual giving.
Given that consumer sentiment took a dive in 2025 and is declining further so far in 2026, it is worth keeping an eye on the 2025 closeout and 2026 numbers. Some organizations might benefit from doing some scenario planning, e.g., contemplating what they would do if revenue came in 10% below budget, reviewing their burn rate, and implementing cost-savings measures or productivity improvements.
Equity Markets
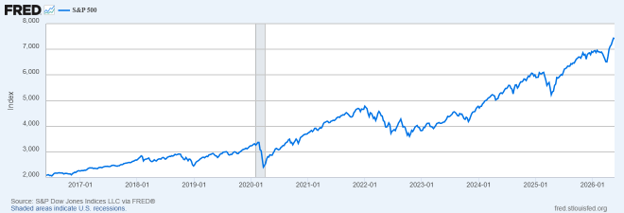
The S & P 500 has maintained upward momentum overall, while at the same time the market has been locked in a choppy and volatile phase that is making many investors nervous.
The price/earnings ratio (using trailing 12-month earnings) of the Standard & Poor’s 500 Index is approximately 32.6 as of May 2026. This is well above the 10-year average of 25.8 and the 20-year average of 24.8. Put simply, people are paying more for earnings than is typically the case.
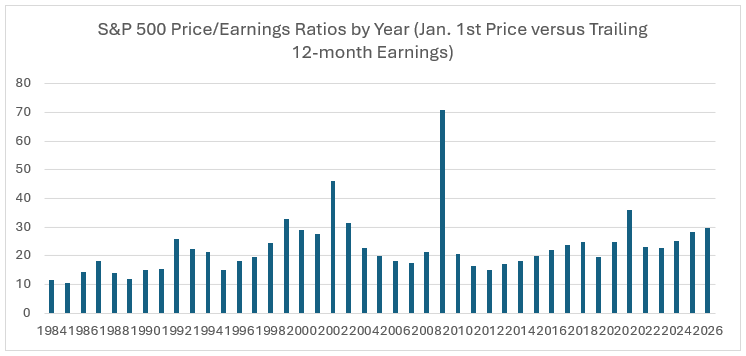
Generally, valuations rise during bull markets, then when the economic engine begins to lose steam, earnings drop faster than valuations. As a result, sometimes valuations are at their highest at the beginning of a major economic downturn, as was the case in 2009.
Valuations overall are somewhat high, but unfortunately so is inflation. Valuations had been buoyed by some hope that the FOMC would cut a key interest rate; however, the Federal Reserve has twin mandates, one of those is to manage inflation, and inflation is accelerating. It is now looking possible, if not likely, that the Fed will increase that interest rate at some point in the next 12 months to tame inflation (accelerating because of both supply chain interruptions affecting particular routes and products, and because the U.S. is borrowing money to finance this silly war in Iran). It is possible that an increase in this key interest rate will result in reduced equity valuations (in particular for tech stocks) and result in higher borrowing costs for capital intensive industries such as manufacturing or real estate, and limit the potential earnings of many financial services firms. Another current concern related to the stock market is the concentration of value in a small number of “megacap” companies – a significant decline in value for any of these firms could have a big impact on the value of donors’ portfolios.
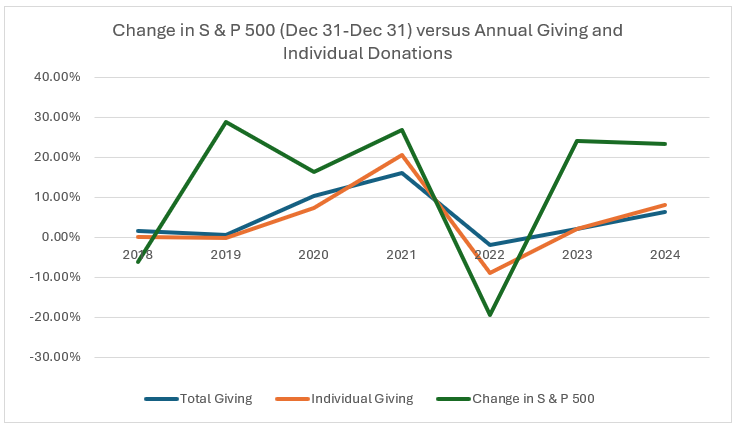
Data from FRED and from Giving USA indicates that donations – especially individual donations – track overall stock market performance.
Employment and Labor Force
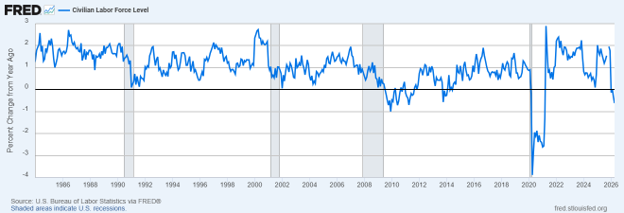
The civilian labor force is shrinking, which limits opportunities for growth. In January of 2025, the civilian labor force was 2.02% larger than the previous January. In April of 2026, the civilian labor force is 0.62% smaller than it was in April of 2025. Of course, nowhere is this more of a problem than in the three oldest states in the union (age-wise): Maine, Vermont, and New Hampshire.
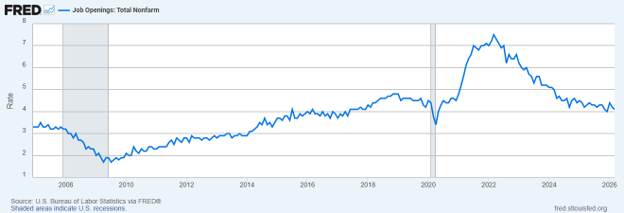
The U.S. economy is at or near full employment, with an unemployment rate of 4.3%, and a job openings rate of 4.1%. The job openings rate has been in general decline since 2022, which often indicates that either the economy is contracting or that the growth in the economy is accruing the capital and not to labor.
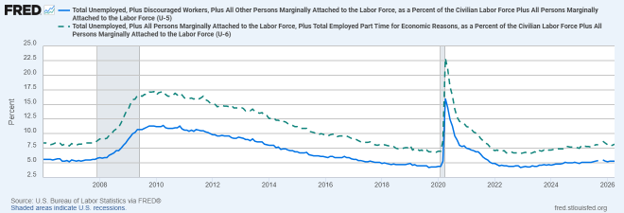
Underemployment has ticked up recently, though by most measures is “in the general vicinity” of where it has been for a while – for example, “U-6” (the unemployment rate that captures people who are part-time but not by choice and all people marginally attached to the workforce) was 8.2% in April, up from 8.0% in March and 7.8% in April of 2025. However, it is lower than it has been for much of the past two decades.
While underemployment and pressure on hours and wages are affecting many households, it isn’t clear that there is a stimulative economic policy or likely technological advance that would substantially increase employment growth the U.S. economy without exacerbating the inflation problem (currently, on the technological front the issue is technology replacing human labor rather than creating new employment opportunities). And looking at employment by industry, the general trend is a shift from higher wage/knowledge economy jobs to lower wage jobs, at the same time that changes to immigration policy have actually or functionally reduced the population of people who have typically supported the employment base in industries like construction, hospitality, and restaurants.
Obviously, if the employment situation worsens, then demand for some services provided by non-profits will increase. But there are no reasons to believe that we will see a rapid deterioration of the labor market (“dis-employment”) in the next year, so changes in employment are unlikely to drive changes to giving. However, reductions in disposable income from underemployment or from the gradual shifting of workers from high wage/knowledge economy jobs to lower wage jobs could affect individual donations over the longer-term. For what it is worth, in recent years donations have been around 1.8% to 2.0% of disposable income, so a decline in the number of people with income and/or the amount of income that is disposable are both factors that could affect donation revenue.
Inflation
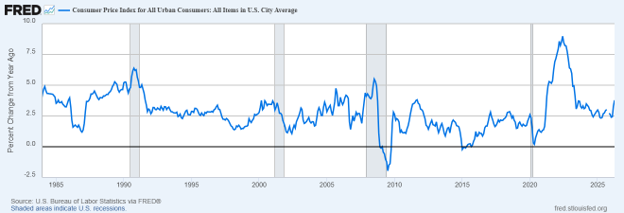
Inflation remains stubbornly high, and month-over-year inflation is both elevated and rising. Consumer prices for urban consumers in April of 2026 were 3.8% above where they were in April of 2025, representing the largest month-over-year jump since May 2023 (4.1% higher than May of 2022), which was the tail end of the prolonged post-pandemic inflationary period that began in March of 2021 and ended in June of 2023.
Inflation obviously affects non-profits on the expenditure side, especially non-profits that provide goods (such as food or fuel) to at-risk households. Across the northeastern United States, prices for food at home generally (up 4.2% versus April 2025) are up sharply, including cereals and baking products (up 4.9%), fruits and vegetables (up 8.3% overall, though tomato prices are up 33% in the last two months!). Shelter is up 4.8%. Fuel prices and utilities’ prices are up 13.6% overall, with household energy up a remarkable 15.6%. Motor fuel costs are up more than 30% compared to April 2025. For more on prices, see the U.S. Bureau of Labor Statistics April release. Prices for many categories of household expenditure have increased much more quickly than the prices for services and hence the wages paid to service providers in an economy that is largely service based.
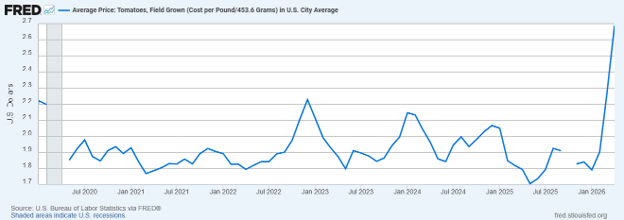
Tomato prices are really skyrocketing. I can’t afford tomatoes anymore and neither can you.
Inflation also puts the squeeze on the household finances of individual donors. That said, relationship between inflation rates and individual giving is not particularly strong and is challenging to isolate from other economic factors (such as consumer confidence).
The Iran War and Its Impact on the Macro
To the extent that current economic conditions are a function of the Iran War, there are reasons to be both optimistic and pessimistic. One the plus side, Congressional Republicans have grown weary of the war and appear to be more ready to exercise some of their constitutional authority over defense appropriations and war declarations. On the other hand, if the problem were easily resolved then it would have been resolved decades ago – the issues of Iran’s desire to exert more control over the Strait of Hormuz and Iran’s nuclear energy and defense programs have been unresolved for many years.
More to the point, even if the Iran War does wind down, the inflationary pig moves slowly through the python – i.e., many upstream and midstream industries have absorbed tighter margins, and there tends to be a delay between producer price inflation and the consumer price inflation that gets passed on to downstream industries and consumers. And there is a reason that “prices are sticky on the upside” is a truism…and that is because it is true. All of which is a long way of saying that I do not think that an easy off-ramp exists and that even if one is found it may not end up altering the trajectory of our economy. On the other hand, the macro fundamentals were much stronger before the conflict began, so perhaps an end to the conflict will return us to a relatively stable economic footing.
Budgeting During Periods of Uncertainty and Volatility
As a budget nerd, my recommendation to organizations that are trying to budget during this period of high uncertainty and volatility is to consider some alternative scenarios. Identify the risks, develop or enhance processes for monitoring those risks, craft some potential response and contingency plans, and make sure that your financial house is in order.
In fact, simply asking and answering a question like “what would we do if revenue comes in 10% below budget?” imposes some discipline on the budgeting process and communicates to stakeholders that you recognize the risks and have a plan. Similarly, re-examining your financial policies and resource allocations is useful given that you might need to plug a hole in your budget. Do you know where those resources would come from? Have you identified any potential efficiency improvements that haven’t been implemented? Put simply, thinking through the scenarios and what can be done if they arise will enable a non-profit organization to respond more quickly if such adjustments are needed.
Literature Review
If you are interested in any other reading on this topic, I have a few recommendations:
If your organization does not already have a subscription to Giving USA, I do recommend it.
From least nerdy to nerdiest, here are some resources:
- If you want more but aren’t an economics or finance nerd and don’t have much time, this piece about economic indicators that non-profits should monitor is worth the 5 minutes required.
- This piece from PNC Bank is accessible and relatively short, while also providing useful data points and guidance.
- Not without some nerdy characteristics, this piece by Blackbaud Institute is very readable and might be a good choice for those who want to read more.
- A little nerdy, but this history of giving during recent recessions is worth a look for those who have the time and inclination.
- Kinda nerdy and a little dated, but I like this Great Recession era piece about giving during that period.
- Super nerdy economic research on how perceptions of income inequality affect giving.
Keep an eye out for more Northeasterly later in early June! As always, if you want to connect with me and just nerd-out, feel free to touch base with me by e-mail at jacob@harpswellstrategies.com. Until next time…be well, stay safe, and shop local!
